brot2: a fractal plotter
Revisiting the work of a great mathematician.
Banner image: Mandelbrot centred at (0.250648691259948, 2.6343326303079e-05), maxiter=16384, horizontal axis=3.176e-06
When Benoit Mandelbrot passed away in 2010, I was inspired to revisit his work (as, it turns out, were some of my friends). This is my second Mandelbrot plotter; the first was cryptically named ‘brot’, was pretty basic, and is lost to the mists of time; this one is an interactive GTK+ application.
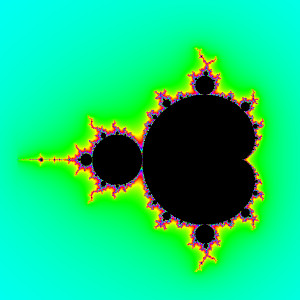
Mandelbrot@(-0.67, 0.1) max=768 axis=(3,3)
See also
Feature list
- mouse-driven navigation (click to zoom in/out and recentre);
- specific zooming by dragging out a rectangle;
- multiple extensible palettes;
- linear antialiasing;
- save image as PNG;
- draws a number of related fractals as well as the original Mandelbrot set and can be relatively easily extended to add more.
Getting brot2
brot2 is free software: you can redistribute it and/or modify it under the terms of the GNU General Public License as published by the Free Software Foundation, either version 3 of the License, or (at your option) any later version.
brot2 has a project page on LaunchPad. You can get it:
- From the releases page;
- from its its release builds PPA;
- from the daily-build PPA; or
- by cloning from the repositiory and building it yourself:
git clone git://github.com/crazyscot/brot2.git- browse
In order to build brot2, you will need to have various gtk and gtkmm developer libraries installed (amongst others). They are listed in the debian/control file (and taken care of if you use the standard package building tools).
 max=24576 axis=(3.176e-06,3.176e-06).jpg)
Mandelbrot@(0.250650639435726,
2.7211535074015e-05) max=24576
axis=(3.176e-06,3.176e-06)
Using brot2
You can move around the plot using your mouse (or equivalent pointing device). The first time you run brot2, the Controls window appears; you can hide and show it via the Options menu. By default the controls are:
- Left-click to recentre around the spot clicked on.
- Drag with the right button to mark out a rectangle to zoom in to. (It may be adjusted to fit the window.)
- Middle-click to zoom out around the spot clicked on.
- Button 8 (the 4th button on my Kensington Expert Mouse) to zoom in, centred on the spot clicked on.
- Scroll wheel up and down zoom in and out, centring around the pointer’s current location.
- Keyboard ‘+’ and ‘-’ zoom in and out around the current centre of the plot.
There is a simple single-step undo mechanism. This is designed to let you recover from the “oh dear, I clicked somewhere silly, where was I?” scenario.
The current fractal position is shown in the heads-up display overlaid onto the window. You can change its size, colour, transparency and positioning via the Preferences dialog.
If you want to specify your plot numerically, you can do this via the Parameters dialog.
The plot and window sizes are always the same; if you resize the window, the plot is redrawn to fit.
You can save the current plot as a PNG file, with the option to save at a different size. (Changing size may take a while as the image has to be re-plotted.) The HUD is not drawn onto a saved image.
For better image quality, activate the antialiasing mode (Ctrl-A). This takes longer to draw as it has to plot four times as many points and average across them. (This is a pretty naive linear antialiasing; better ways remain to be found and implemented.)
brot2 has the notion of a plot being “good enough” to stop computing. This is expressed as a fraction (percentage) of the pixels which should have escaped (or be provably within the set), and a proportion of pixels continuing to escape in each pass. This is a tricky compromise between drawing enough detail and not taking forever, and it doesn’t always get it right; you can tune it via the Preferences dialog. You can always stop a plot with Ctrl-. or ask it to make another pass (“More iterations”) with Ctrl-M.
There are multiple colour palettes. At the moment these are hard-coded. Changing colour scheme is a quick and cheap operation; you can even cycle through them with Ctrl-3 and Ctrl-4.
 max=3072 axis=(4.643e-10,4.643e-10).jpg)
Mandelbrot@(-0.761228719917374,
0.0847858796416676) max=3072
axis=(4.643e-10,4.643e-10)
What’s in a name?
This is my second Mandelbrotter.
The first was cryptically named brot; both the origins of its name, and the code, are lost in the mists of time. It was a bit pants, even by the standards of the time; it took its parameters on the command line and output as a TIFF, ASCII art or to a terminal which understood ANSI graphics codes. (I claim this as a dubiously legitimate reason for setting xterm to ‘unreadable’ :-) )
This one is a bit better featured, but to me it’s logically the heir to its now-departed ancestor, hence the name.